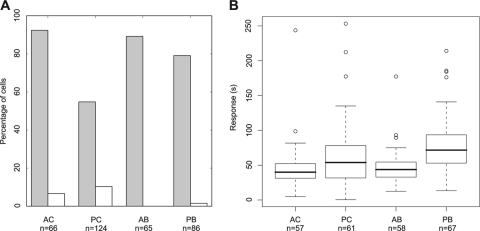
Fig. 3.
Chemosensory responses of bacterial populations grown in AC (aerobic chemostat), PC (photoheterotrophic chemostat), AB (aerobic batch), and PB (photoheterotrophic batch) conditions. “n” is the number of cells analyzed for each condition. (A) Total percentage of responsive cells (gray bars) and percentage of responsive cells not adapting (white bars); (B) box plots of the chemosensory response durations of the responsive adapting cells. For each box plot, the lower, middle, and upper horizontal lines of the box represent the first quartile, the median, and the third quartile, respectively. The lower and upper extremities of the dashed lines represent the lowest datum and the highest datum, respectively, which are no more than 1.5 times the interquartile range (difference between the third and the first quartiles) from the box. The circles represent data that are outliers.

