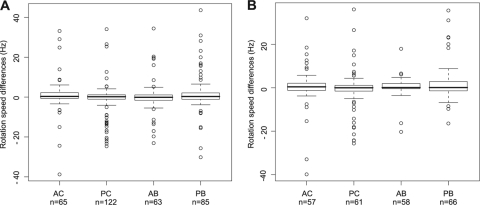
Fig. 4.
Box plots representing differences in speeds of rotation in propionate and tethering buffer of single cells grown in AC (aerobic chemostat), PC (photoheterotrophic chemostat), AB (aerobic batch), and PB (photoheterotrophic batch) conditions. For each box plot, the lower, middle, and upper horizontal lines of the box represent the first quartile, the median, and the third quartile, respectively. The lower and upper extremities of the dashed lines represent the lowest datum and the highest datum, respectively, which are no more than 1.5 times the interquartile range (difference between the third and the first quartiles) from the box. The circles represent data that are outliers. “n” represents the number of cells analyzed for each condition. (A) Differences between single-cell rotation speeds in propionate and in the first tethering buffer flow; (B) differences between single-cell rotation speeds in propionate and in the second tethering buffer flow.

