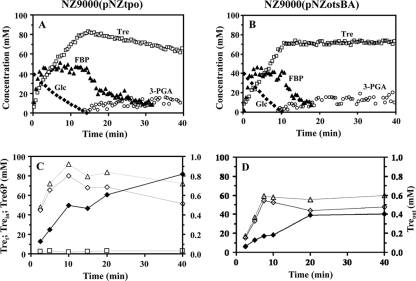
Fig. 4.
(A and B) Kinetics of [1-13C]glucose (40 mM) consumption and pools of metabolites in resting cells of L. lactis strains engineered for the synthesis of trehalose: NZ9000(pNZtpo) (A) and NZ9000(pNZotsBA) (B). The experiments were monitored online by in vivo 13C-NMR and carried out at 30°C under anaerobic conditions and with the pH controlled at 6.5. Maximal glucose consumption rates (μmol min−1 mg protein−1) were 0.33 (A) and 0.39 (B). Symbols: closed diamonds, glucose; closed triangles, fructose 1,6-bisphosphate; open circles, 3-phosphoglycerate; open squares, total trehalose plus trehalose 6-phosphate expressed as an intracellular concentration. (C and D) Parallel experiments were run to study the kinetics of trehalose 6-phosphate and trehalose (intracellular and extracellular pools) in NZ9000(pNZtpo) (C) and NZ9000(pNZotsBA) (D). The extracellular trehalose concentration was determined in cell supernatants, while intracellular trehalose and trehalose 6-phosphate concentrations were determined in perchloric acid extracts. These metabolites were quantified by proton NMR. Symbols: closed diamonds, extracellular trehalose; open diamonds, intracellular trehalose; open triangles, total trehalose expressed as an intracellular concentration; open squares, trehalose 6-phosphate. Each type of experiment was performed twice, with good reproducibility.

