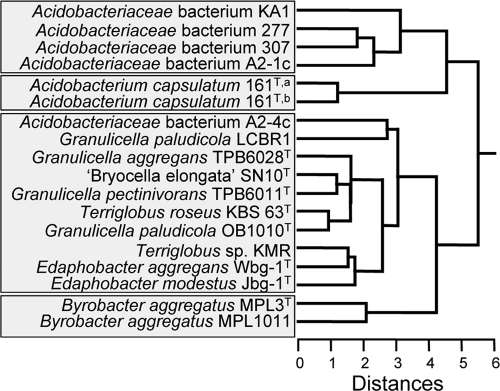
Fig. 3.
Multivariate statistical analysis of the distribution of the lipids released by acid hydrolysis of cell material of the acidobacteria studied. The input of the cluster analysis was the Bray-Curtis similarity matrix of lipid profiles (% of total lipids; Table 2). A hierarchical clustering was performed in SYSTAT 13 using Euclidian distance and the average-linking method. A. capsulatum 161 was grown at both the DSMZ (a) and the Winogradsky Institute (b).

