Figure 1.

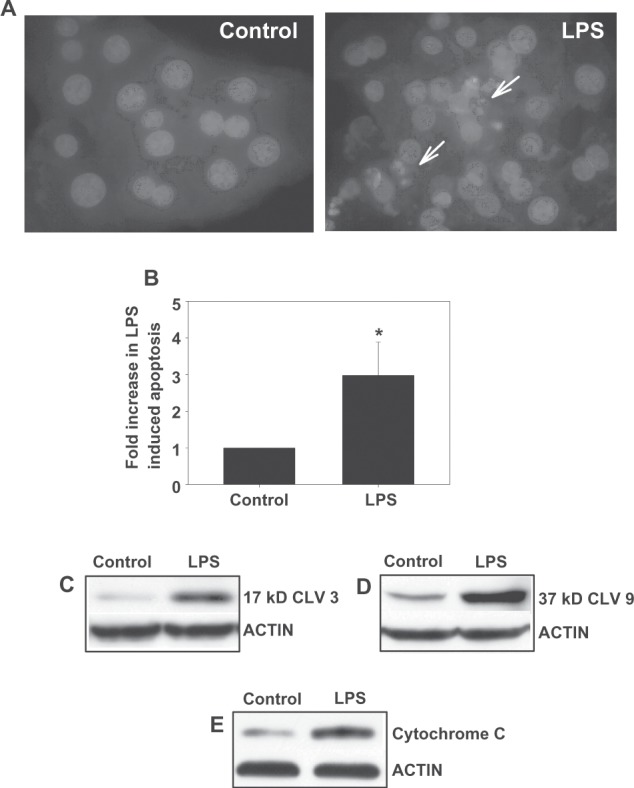
LPS induces apoptosis in hepatocytes. Hepatocytes were treated overnight with 500 ng/mL LPs and cells were evaluated morphologically by Hoechst staining for the presence of apoptosis. Representative photomicrographs (100×) are shown; the arrows depict apoptotic hepatocytes (A). The amount of apoptosis was quantified by counting the number of hepatocytes with apoptotic morphology and is expressed as a percentage of the amount of apoptosis seen in the control and represents mean ± sD [n = 3–5] (B). Biochemical evidence of apoptosis was also obtained by immunoblotting for the 17 kD or 37 kD cleavage product of caspase 3 or caspase 9, respectively (C and D). Cytosolic preparations were immunoblotted for the appearance of mitochondrial cytochrome C (E). *Significantly different from control, P < 0.05.
Abbreviations: LPS, lipopolysaccharide; SD, standard deviation.
