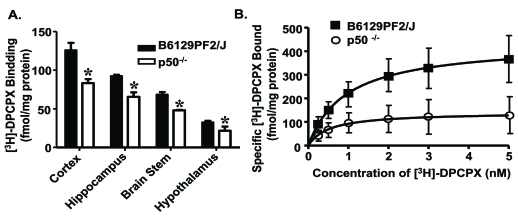
Fig. (1).
A1AR in brain of p50 KO mice. (A) A1AR binding in F2 and p50 KO mice (n = 4 per strain) was quantified in membrane fractions of cortex, hippocampus, brain stem, and hypothalamus using the specific A1AR antagonist [3H]-DPCPX (1 nM). Values are expressed as fmol/mg protein and represent mean ± S.E.M. for three independent experiments with samples assayed in triplicate (* p < 0.05, Student’s t-test). (B) Saturation binding analysis of cortical membrane for A1AR with [3H]-DPCPX in the absence (total binding) or presence (nonspecific binding) of 0.5 mM theophylline (n = 5 per strain). Curves were fitted to a one-site model using GraphPad Prism. Modified from Jhaveri et al., 2007, Neuroscience 146, 415-426, with permission from Elsevier.

