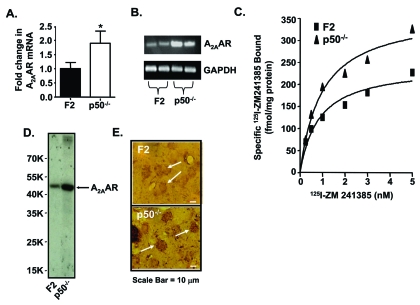
Fig. (3).
A2AAR in striata of p50 KO versus F2 mice. (A) Real time PCR (A; n = 10 per group). (B) Traditional PCR (n = 2 per group). (C) Saturation curves with inset. Scatchard plot for 125I-ZM241385 binding to A2AAR in mouse crude striatal membranes. The plots shown represent pooled striata from 4 mice, with samples at each concentration assayed in triplicate. This analysis was repeated on 3 different pooled samples with similar results. (D) Affinity purification of the A2AAR from F2 and p50 KO striata (n = 4 per strain). E) Immunohistochemistry of striatal A2AAR from F2 and p50 KO mice (n=4 per strain). Arrowheads depict specific A2AAR-immunolabeled neurons. The sections represent a 400-fold magnification of the image. Scale bar represents 10 µm. Reprinted from Xie et al., 2007, Life Sci 81, 1031-1041, with permission from Elsevier.

