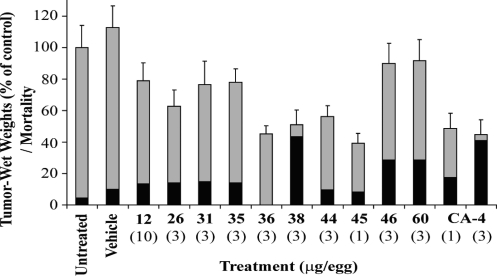
Figure 2.
Effect of compounds 12, 26, 31, 35, 36, 38, 44–46, 60, and CA-4 on HT 1080 tumor growth and embryo’s toxicity using the CAM model. Gray bars represent the percentage of tumor-wet weight of tumors treated with and without excipient. Black bars represent the percentage of chick embryo mortality.

