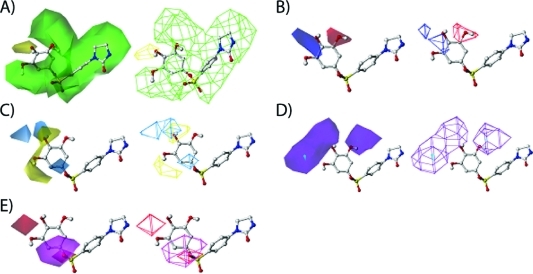
Figure 4.
Contour maps of CoMSIA fields contributing to ligand binding generated by PLS analysis in model A (HT-29). Compound 45 (ball-and-stick model) was shown in the figure as a reference to depict the field region. (A) Contour map of steric field. Green areas present favored steric groups, and yellow areas present disfavored steric groups. (B) Contour map of electrostatic field. Blue areas favored electrostatic field (higher positive charge will increase the activity) and red areas disfavored electrostatic field (lower positive charge will increase the activity). (C) Contour map of hydrophobic field. Yellow areas show favored hydrophobic region, and cyan areas show disfavored hydrophobic region. (D) Contour map of hydrogen bond donor field. Cyan regions are the hydrogen bond donor preferred region, and purple regions are where hydrogen bond donor is not favored. (E) Contour map of hydrogen bond acceptor field. Magenta regions depict the favored hydrogen bond acceptor region, and red regions illustrate the hydrogen bond disfavored region.

