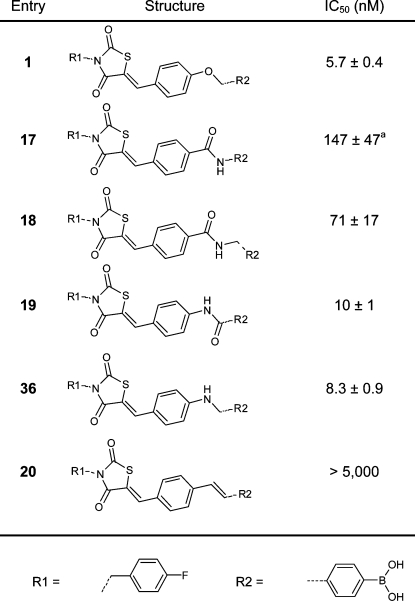
Table 1. IC50 Values of the Inhibitors Resulting from the Linker Modification.
IC50 values have been determined in the choline release assay using 40 μM LPC and 10 nM ATX. The dose–response curve of inhibitor 17 shows biphasic curve (see Supporting Information Figure S2).

