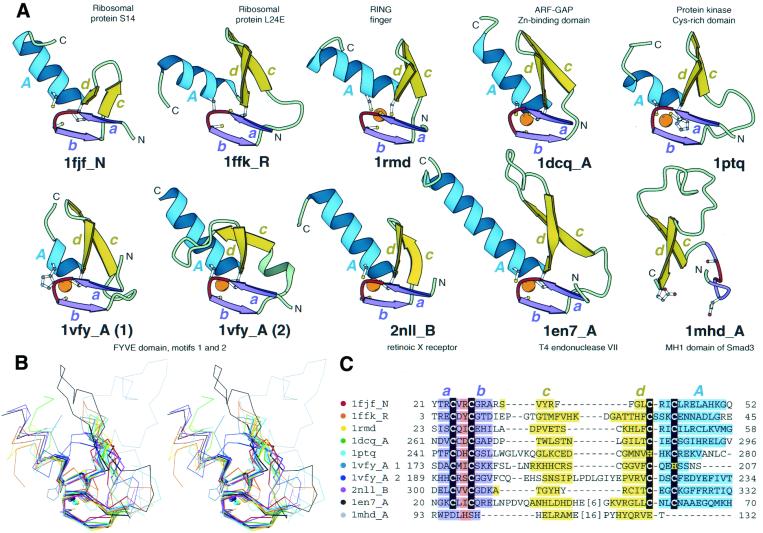
Figure 1.
Structural comparisons of representative treble clef fingers. (A) Structural diagrams of ribosomal protein S14 (1fjf, chain N, residues 21–53), ribosomal protein L24E (1ffk, chain R, residues 3–45), RING finger of RAG1 (dimerization domain) (1rmd, residues 23–60), ARF-GAP domain of Pyk2-associated protein β (1dcq, chain A, residues 262–297), Cys2 activator-binding domain of protein kinase Cδ (1ptq, residues 241–280), FYVE domain of Vps27p protein, first treble clef finger (1vfy, chain A, residues 172–207), FYVE domain of Vps27p protein, second treble clef finger (1vfy, chain A, residues 190–235), retinoid X receptor α DNA-binding domain (2nll, chain B, residues 300–336), recombination endonuclease VII (1en7, chain A, residues 19–79), MH1 domain of Smad (1mhd, chain A, residues 93–132) showing the treble clef finger domains from each protein. In each protein, N- and C-termini are labeled with N and C. β-Strands and α-helices are labeled in lower and upper case letters, respectively. The color of the letter corresponds to the color of the element. The short β-strands in the zinc knuckle region are shown in purple (a and b) with the zinc knuckle turn colored red. Side-chains of zinc ligands and corresponding residues in 1mhd are shown in ball-and-stick representation. Zinc ions are shown as orange balls. The ribbon diagrams were rendered by Bobscript (23), a modified version of Molscript (24). (B) Stereo diagram of superimposed Cα-traces of the 10 structures from (A) shown in the same orientation. The Cα-traces of proteins, side chains of zinc ligands and Zn2+ are shown. Superpositions were made using Insight II package (MSI). The regions used in r.m.s.d. minimization are outlined in thicker lines. Color coding of structures corresponds to the dot color scheme (in front of each PDB entry) in (C). (C) Structure-based sequence alignment of treble clef motif regions of the 10 proteins illustrated in panel (A). For each sequence, the PDB entry name and chain ID, starting and ending residue numbers are given. Zinc ligands are boxed in black. Color shading and labels of secondary structure elements correspond to those in (A). Long insertions are not displayed: the number of omitted residues is specified in brackets.

