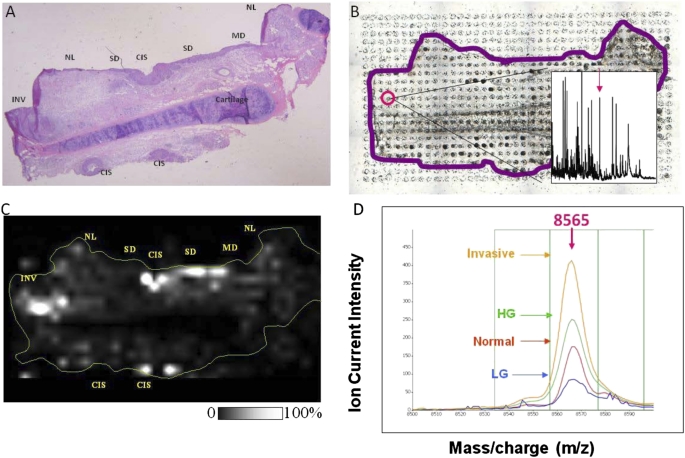
Figure 2.
Preinvasive proteins biomarker candidate from a lung tumor biopsy detected by matrix-assisted laser desorption ionization imaging mass spectrometry (MALDI MS). (A) Hematoxylin and eosin image of the tissue section. (B) Array of matrix deposited on a serial section for MS analysis. (C) MALDI MS image of the protein at m/z 8565, demonstrating overexpression in high-grade preinvasive and invasive areas. Gray scale provided, white corresponding to the highest intensity. (D) MALDI MS peak of the candidate biomarker protein at m/z 8,565 demonstrating differential peak intensity variations in normal, preinvasive, and invasive tissues (LG, low grade; HG, high grade).

