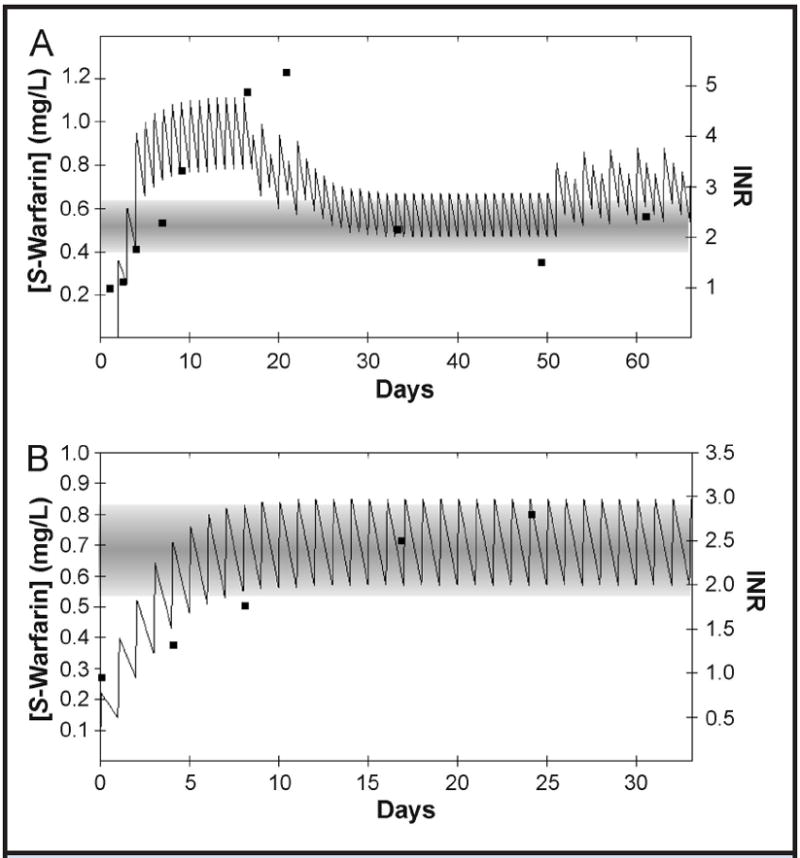
Fig. 4. Graphical representation of the output for the clinical decision–support tool.

(A), Model of a patient’s course of S-warfarin therapy as described by LaSala et al. (40). (B), Model of a patient’s course of therapy as managed by one of the authors (B.F. Gage). In each panel, the closed squares represent the patient’s measured INR values (right y axis). The plotted solid line represents the estimated plasma S-warfarin concentration (left y axis), which is based on the patient’s warfarin dosage and CYP2C9 genotype and calculated with our clinical decision–support model. The horizontal shaded band represents the target therapeutic interval of S-warfarin concentration according to the individual’s VKORC1 genotype.
