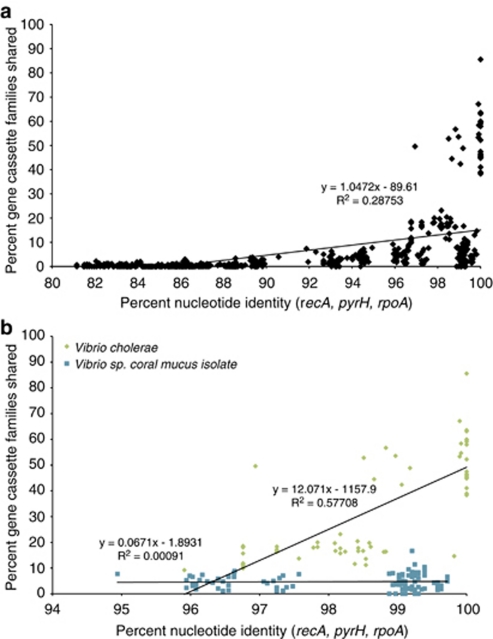
Figure 3.
Pairwise comparison of the genetic identity versus integron gene-cassette array conservation in Vibrio isolates. (a) All Vibrio isolates for which gene cassettes have been sequenced. (b) Vibrio cholerae isolates as well as Vibrio strains collected from coral mucus and their close relatives. The trend line was obtained through a linear regression analysis of all data points, each point representing a pairwise comparison of isolates based on their combined recA, pyrH and rpoA housekeeping-genes nucleotide identity and the gene-cassette families they share. The R2 values were calculated using the square of the Pearson product moment correlation coefficient through the given data points.

