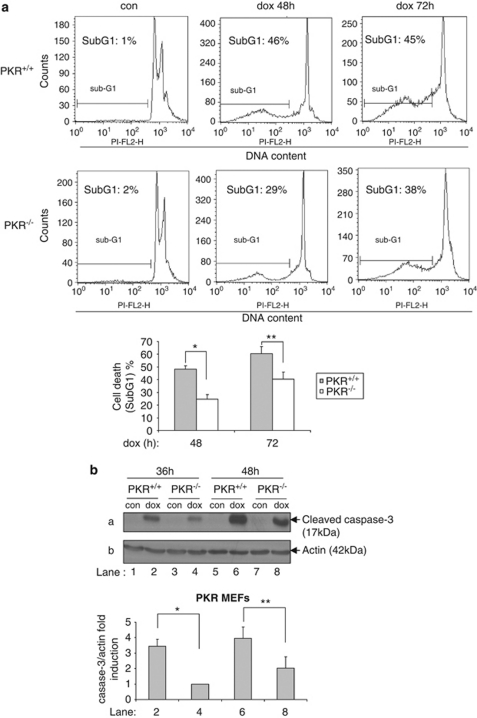
Figure 1.
PKR promotes doxorubicin-induced cell death. (a) PKR+/+ and PKR−/− MEFs were left untreated (con) or treated with 1 μM doxorubicin (dox) for the indicated time periods. Cells were subjected to FACS analysis after propidium iodide staining. Cell death is represented by the percentage (%) of cells in sub-G1. Histograms represent the mean cell death from five independent experiments after subtraction of background cell death (untreated control cells) (n=5). Statistical significance of the difference as calculated by Student's t-test is with *P<0.0003, **P<0.0009. (b) PKR+/+ and PKR−/− MEFs were left untreated (con) or treated with 1 μM doxorubicin (dox) for the indicated time periods. Protein extracts (50 μg) were subjected to western blot analysis for cleaved caspase-3 (a) and actin (b). Histograms represent the mean value of the ratio of cleaved caspase-3 to actin after normalization to that of lane 4 for the indicated lanes of the western blot from five independent experiments (n=5). *P<0.005, **P<0.006

