Figure 1.
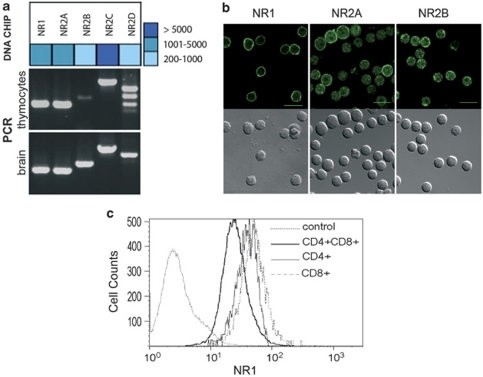
T cells express a large array of i- and m-GluRs. (a) Oligoarray (Neurotrans) analysis of NMDAR mRNA expression on thymocytes compared with brain (upper panel), and validated by RT-PCR compared with brain (lower panel). Oligoarray data are shown as a heat map. Data for all GluRs are shown in Supplementary Figure S1 using primers shown in Supplementary Table S1. (b) Immunofluorescence analysis of NMDAR subunit expression on thymocytes. For each indicated NMDAR subunit (NR1, NR2A, NR2B), a Nomarski image (bottom row) and a confocal fluorescence image is shown in an equatorial plane (top row). Images for other ionotropic glutamate receptors (iGluRs) are shown in Supplementary Figure S1c. Control staining consisting in IgG2b isotype control (for anti-NR1 antibody) or purified rabbit IgG (for anti-NR2A, NR2B, GluR2/3, KA2 antibodies) were negative using the same settings as the specific staining (Supplementary Figure S1c). (c) Flow cytometry analysis of NR1 expression in thymocytes. Antibodies that detect NR1 as a band at the expected molecular weight by western blotting in brain microsomal preparations were used. Relative fluorescence intensity is shown for CD4+, CD8+ and DP subpopulations. Data are representative of three independent experiments. IgG2b control isotype is shown as control for NR1 staining

