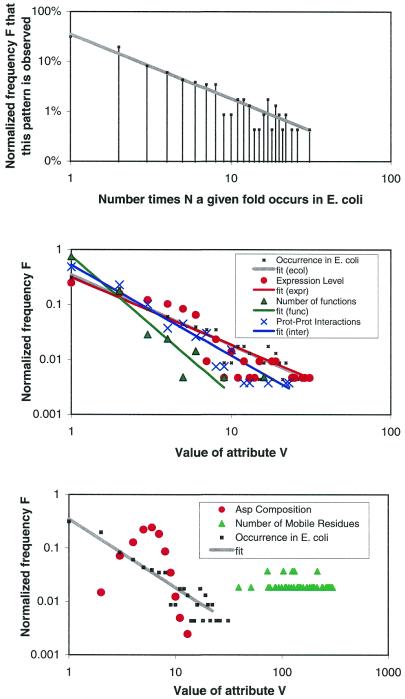
Figure 5.
Some novel relationships that are highlighted by the PartsList system. (Upper panel) The occurrence of folds in the E.coli genome plotted on a log–log scale, i.e. G(ecol) using the nomenclature in Table 1. The x-axis is the fold occurrence in the genome, while the y-axis is the number of folds with a particular occurrence. The fit of the points to a straight line shows that the falloff obeys a power-law with constants a = 0.35 and b = 1.3 (see text). (Middle panel) Other attributes that also follow power-law behavior: the average expression level according to our merged and scaled set [L(ref) with a = 0.3 and b = 1.2), the number of protein–protein interactions [I(pdball,none) with a = 0.52 and b = 1.6], and the number of functions [X(func) with a = 0.76 and b = 2.5]. (Lower panel) Some attributes that do not follow power-law behavior: the Asp composition of the fold [B(Ala,pdb100)] and the number of mobile residues during a motion [M(nresidue,auto)]. The fold occurrence in E.coli is plotted as a reference.

