Figure 3.
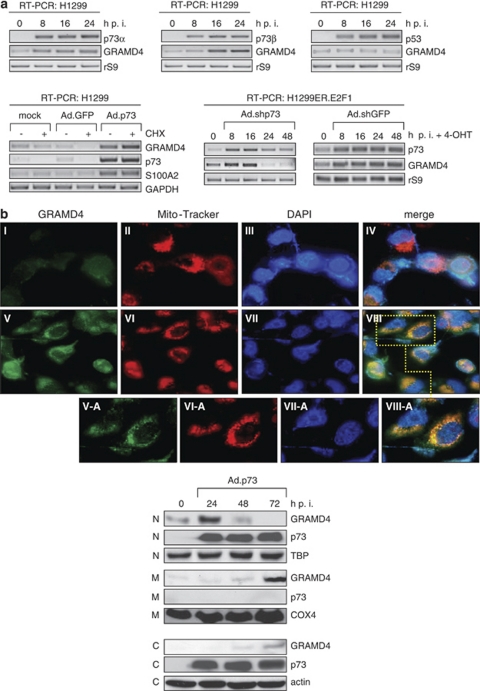
p73 induces GRAMD4 transactivation and mitochondrial translocation. (a) Upper panels: semi-quantitative RT-PCR analysis on total RNA for endogenous GRAMD4 expression in H1299 cells at 8, 16 and 24 h following infection with Ad.p73α (left), Ad.p73β (middle), and Ad.p53 (right). Data were normalized to rS9 values. Bottom panel, left: GRAMD4 mRNA levels were assessed in parental H1299 cells infected with Ad.p73β and Ad.GFP control virus in the absence or presence of CHX by semi-quantitative RT-PCR and normalized to GAPDH expression. S100A2 is shown as a control for a direct p73 target gene. p73 expression is as indicated. Bottom panel, right: upregulation of GRAMD4 by endogenous p73 in H1299.ER-E2F1 cells at indicated time points after E2F1 activation in response to 4-OHT addition. GRAMD4 and p73 transcript levels were detected in Ad.shp73 and Ad.shGFP infected compared with untreated cells using RT-PCR. Data were normalized to rS9 values. (b) Upper panel: endogenous GRAMD4 protein expression in H1299 cells at 72 h after transfection with p73β expression plasmid (V–VIII) or control pcDNA (I–IV) was detected using anti-GRAMD4 and Alexa Fluor 488 (anti-rabbit). Mito-Tracker and DAPI were used for visualization of mitochondrial and nuclear staining by laser scanning microscopy. GRAMD4, green; Mito-Tracker, red; DAPI, blue. Magnification × 40 (I–VIII), × 60 (V–VIII-A). Bottom panel: subcellular localization of endogenous GRAMD4 and ectopically expressed p73 protein shown by western blot at 24, 48, and 72 h after infection of H1299 cells with Ad.p73β using anti-GRAMD4 and anti-p73 antibody. N, nuclear fraction; C, cytosolic fraction; M, mitochondrial fraction. Mitochondrial COX4, cytosolic actin and nuclear TBP were used for equal loading

