Figure 3.
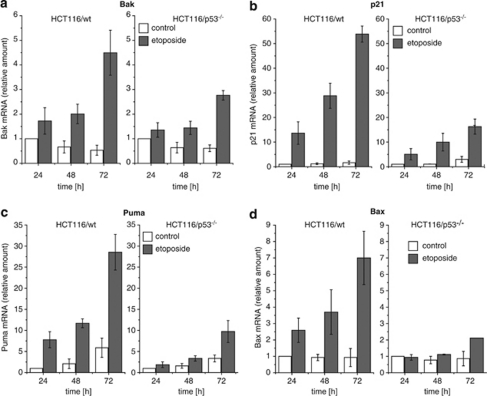
Time course of p53-dependent gene induction in response to DNA damage. The HCT116/wt and HCT116/p53−/− cells were treated with 50 μM etoposide for 24, 48, and 72 h and expression of Bak (a), p21 (b), Puma (c), and Bax (d) mRNA was analyzed by qRT-PCR. The mRNA expression of Bak, Bax, Puma, and p21 rises over time in response to treatment with etoposide in HCT116/wt and to a lesser extent in HCT116/p53−/− cells. Values are means±S.D. from three independent experiments

