Figure 2.
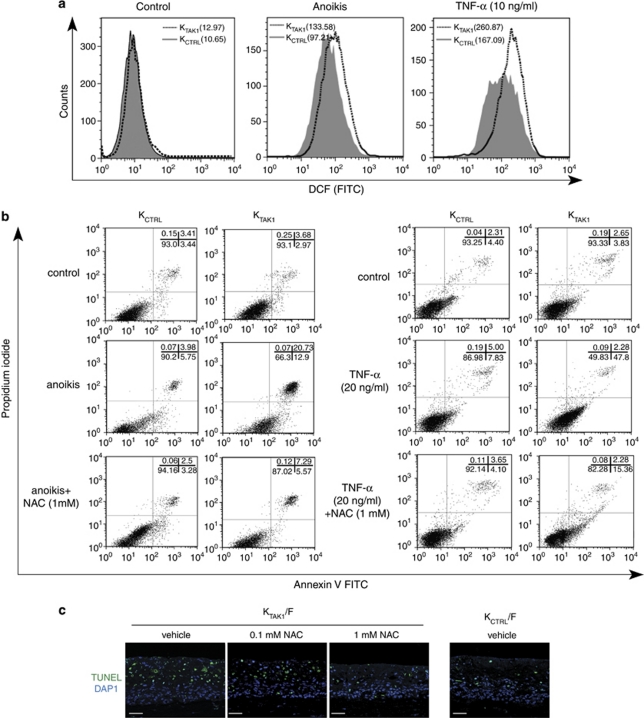
TAK1 deficiency increased ROS accumulation. (a) Representative FACS-derived histograms showing increased ROS in TAK1-knockdown (KTAK1) compared with control human keratinocytes (KCTRL) during anoikis or TNF-α treatment. FACS analysis of KTAK1 and KCTRL stained with DCF (10 000 events). No difference was observed with untreated control cells. Mean fluorescence intensities, indicated in brackets, were obtained from five independent experiments. Data were analyzed using CellQuest software (Becton Dickinson). The analyzer threshold was adjusted on the flow cytometer channel to exclude most of the subcellular debris to reduce the background noise using non-DCF stained cells. (b) Percentage of apoptotic KCTRL and KTAK1 after anoikis or TNF-α treatment, in the presence either vehicle or 1 mM of NAC, as analyzed by FACS (10 000 events). The sum of Annexin V+/PI− (early apoptosis) and Annexin V+/PI+ cells (late apoptosis) were considered apoptotic. Values (mean±S.D., bold) denote apoptotic cells (%) from five independent experiments. (c) TUNEL analysis of KCTRL- and KTAK1-derived OTC sections. OTCs were constructed using either KCTRL or KTAK1 with underlying human primary fibroblasts (F), cultured in the presence of either vehicle or 1 mM NAC and harvested after 2 weeks. Sections used for TUNEL assay were counterstained with DAPI for nuclei (blue). Scale bar=40 μm. Dotted white line represents epidermal–dermal junction

