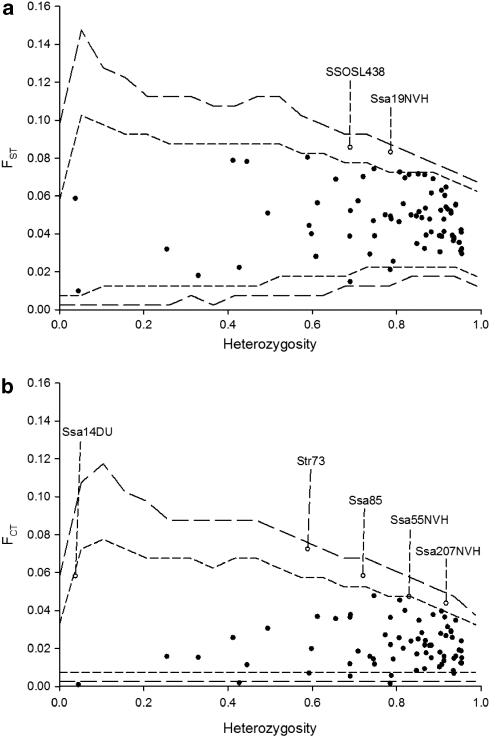
Figure 2.
Results of the hierarchical outlier test involving all loci and all samples. (a) Within regions: FST values are plotted against heterozygosity. (b) Between regions: FCT values are plotted against heterozygosity. Long dashed lines denote 0.01 and 0.99 quantiles, short dashed lines denote 0.05 and 0.95 quantiles. Loci with open circles are candidates for being under diversifying selection.

