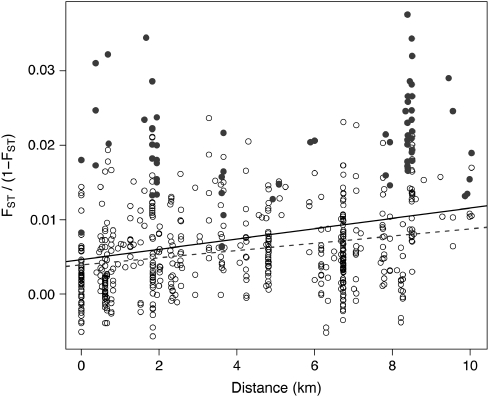
Figure 2.
Relationship between genetic (FST/(1-FST)) and geographic distance (km) for all 35 population-year combinations (all dots, black line: —; Mantel r=0.29, P<0.0001) and excluding two outlier populations (SAN07 and LAG01) identified by the DPR analysis (excluding filled dots, dashed line: - - - -; Mantel r=0.26, P<0.0001).

