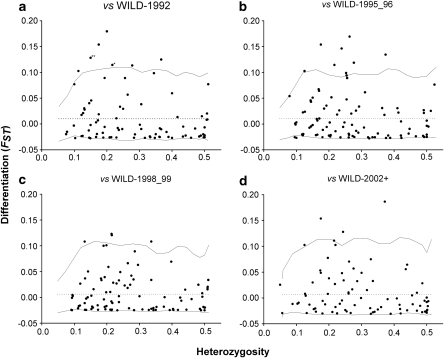
Figure 3.
Differentiation (FST) as a function of heterozygosity as calculated by FDIST2 when comparing FARM-1992 with: (a) WILD-1992, (b) WILD-1996 (c) WILD -1998_99 and (d) WILD-2002+. On each panel, solid line represent upper and lower 95% confidence level and dotted line indicates the average FST across loci. Asterisk (*) on outliers indicate two values represented by the same dot on the graphic (double asterisks (**) three values). Only SNP markers were used.

