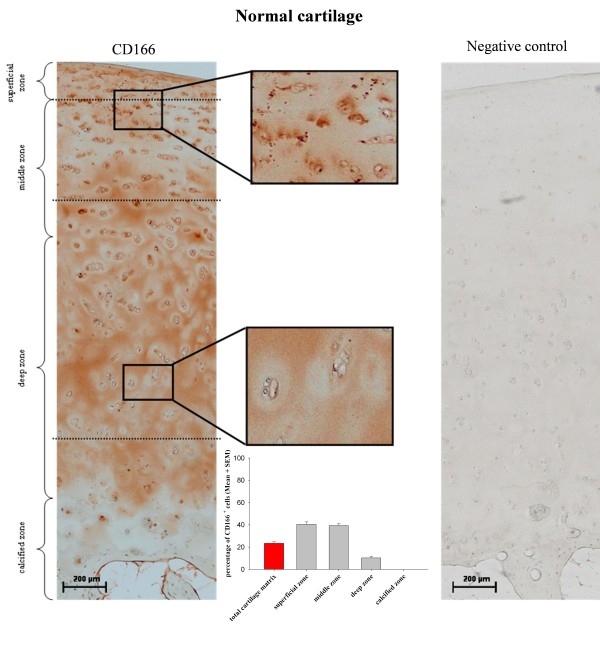
Figure 7.
Distribution of CD166+ chondrocytes within the normal joint cartilage matrix. CD166+ cells within normal cartilage matrix show a distribution pattern similar to that of osteoarthritic cartilage (shown in Figure 6), and the absence of a positive staining signal in the corresponding isotype control proves the specificity of the CD166 staining. Magnifications: 100 × (large micrograph), 400 × (insets). Results of semiquantitative analysis of cartilage samples from three normal donors are expressed as mean ± standard error of the mean (SEM).

