
Figure 4.
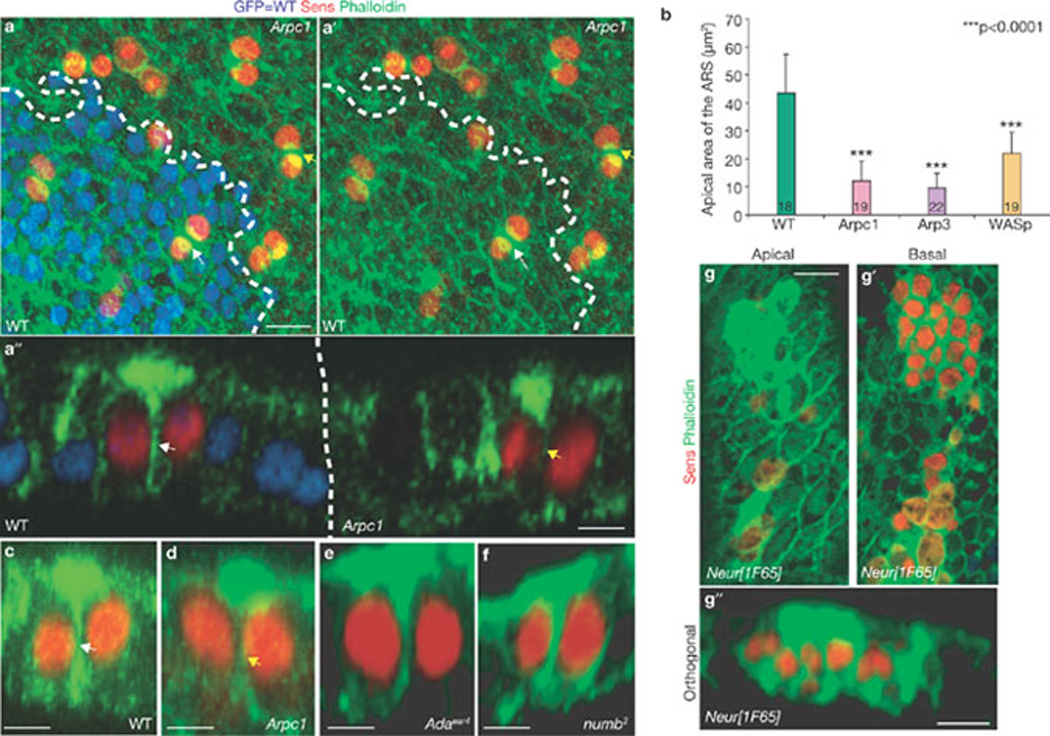
The ARS forms specifically in the pIIa-pIIb progeny and is reduced in Arp3, Arpc1 and WASp mutant SOP progeny. (a, a´) A projection of confocal sections shows that the ARS identified by phalloidin (green) staining is present in both wild-type (WT, white arrow) pIIa-pIIb and Arpc1 (yellow arrow) mutant pIIa-pIIb cells marked by Sens (red). Arpc1 homozygous mutant clones (dotted lines) are marked by the absence of nuclear GFP (blue). (a´´) An orthogonal confocal section shows that the ARS is quite broad in the WT pIIa-pIIb (white arrow) and has an umbrella-shaped structure, whereas the ARS in the Arpc1 homozygous clones (yellow arrow) seems compressed and the lateral ‘stalk’ of the ARS is malformed. (b) Quantification of the apical area of the ARS in different genotypes. The ARS area was quantified using the Measure function of ImageJ software. The measurements were analysed using a Student’s t-test (***P <0.0001). Data are mean ± s.e.m. and the number of SOP progeny pairs used for quantification per genotype is indicated in the bars. (c–g´´) Pupal nota stained with Sens (red) and phalloidin (green) reveal ARS in pIIa-pIIb. Projections of orthogonal slices show the ARS in WT (c, white arrow), Arpc1 (d, yellow arrow), α-adaptin (e), numb (f) and neuralized (g–g´´) pIIa-pIIb. An apical section (g) reveals apical (0.5 µm) actin enrichment whereas a basal section (g´) of the sample (~6 µm) shows the nuclei of the SOP progeny. Scale bars, 10 µm (a, a´´, g, g´´) and 5 µm (c–f).