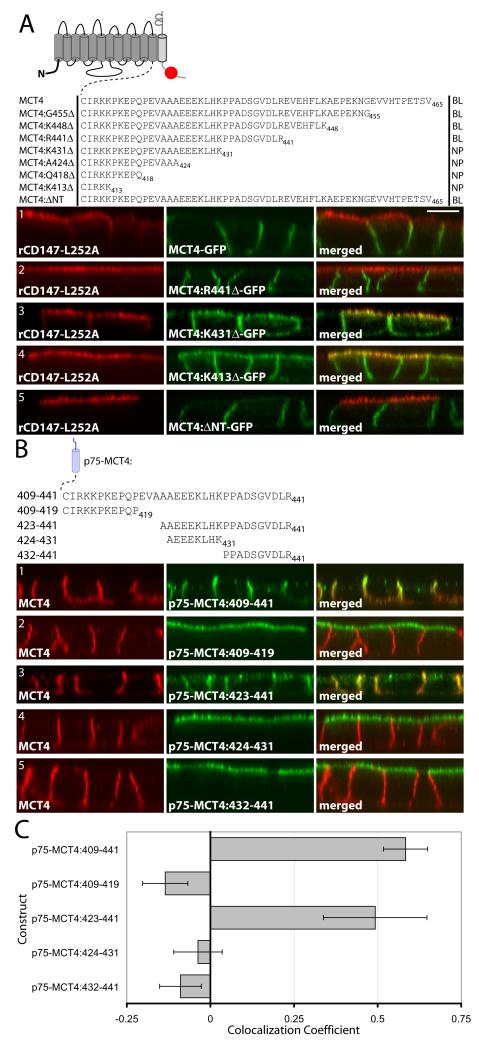
Figure 3. Identification of the MCT4 BLSS.
(A) In order to identify the general location of the BLSS, additional constructs with progressive C-terminal truncations of MCT4 were generated as GFP fusions and stably expressed in MDCK-rCD147-L252A cells. The C-terminal tail sequences and resulting polarity for each construct are shown in the table above the figure (NP=nonpolar, BL=basolateral). Polarized cells cultured on Transwell inserts were fixed and immunolabeled with anti-rat CD147 antibody (red). Images of the MDCK cells were acquired using LSCM. (B) An array of p75 fusion constructs was generated to identify the BLSS activity within MCT4 amino acids 409-441. Polarized MDCK cells stably expressing the p75 fusion constructs were fixed and immunolabeled with an anti-p75 antibody (green) to detect the transgenes and anti-MCT4 antibody (red) as an endogenous basolateral marker. Confocal images are shown as X-Z images of representative sections of the Z-stack. Bar=10μm, all images are same scale. (C) Colocalization analysis was performed on the red versus green channels of confocal Z-stacks as described in Methods and Pearson’s colocalization coefficients were plotted. Error bars are standard deviations of the colocalization coefficients from at least four regions of interest.

