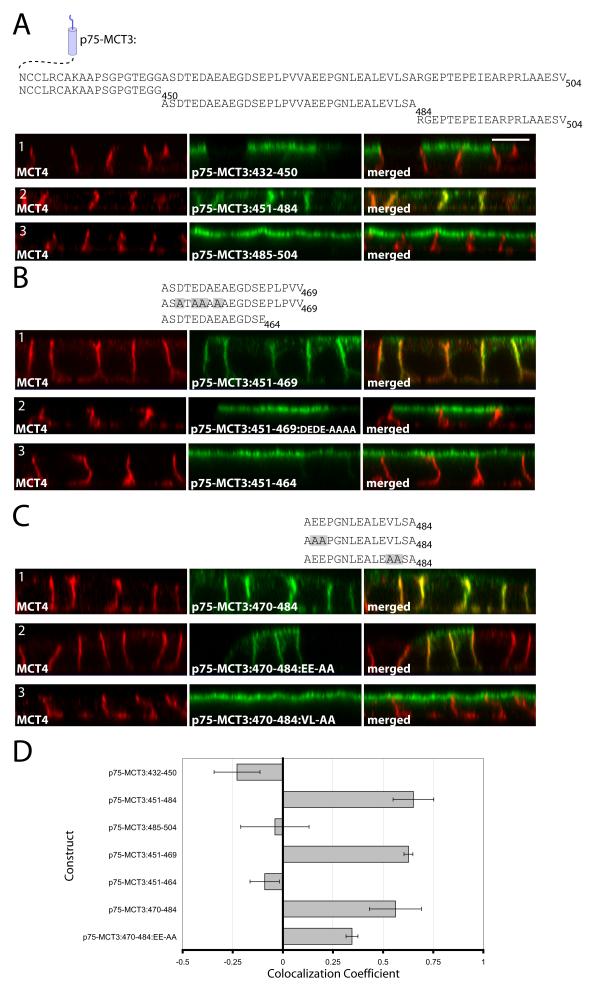
Figure 6. Identifying the BLSS of MCT3.
p75-MCT3 tail constructs comprised of adjacent regions of the MCT3 C-terminal cytoplasmic tail were generated and stably expressed in MDCK cells. The C-terminal tail sequences for each construct are shown above the figure. (A) p75-MCT3 fusions of the C-terminal cytoplasmic tail divided into three sections. MCT3:451-484 was divided into two smaller fragments 451-469 (B) and 470-484 (C) and additional mutation analysis was performed on each of these regions. Polarized cells expressing the p75-MCT3 fusion constructs were fixed and immunolabeled with anti-p75 antibody (green) to detect the transgenes and anti-MCT4 antibody (red) to detect endogenous MCT4. Confocal images are shown as X-Z sections from the Z-stack. Bar=10μm, all images are same scale. (D) Colocalization analysis was performed on the red versus green channels of confocal Z-stacks as described in Methods and Pearson’s colocalization coefficients were plotted. Error bars are standard deviations of the colocalization coefficients from at least four regions of interest.

