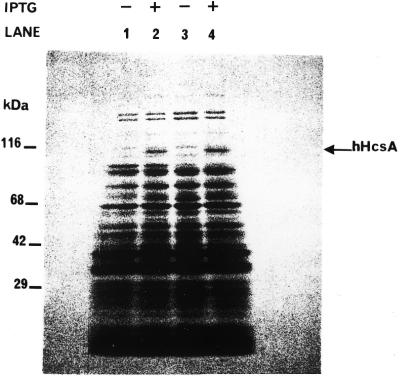
Figure 2.
SDS–PAGE analysis of expression of hHcsAA in E.coli. Induction of expression was carried out as described in the Results in the presence of 0.1 mM IPTG. Equal amounts of cells before and after induction were analyzed by 5–18% SDS–PAGE followed by Coomassie staining. Lane 1, BL21(DE3)/pET29b hHcsA clone #1 cells before induction. Lane 2, BL21(DE3)/pET29b hHcsA clone #1 cells after IPTG induction. Lane 3, BL21(DE3)/pET29b hHcsA clone #6 cells before induction. Lane 4, BL21(DE3)/pET29b hHcsA clone #6 cells after IPTG induction.

