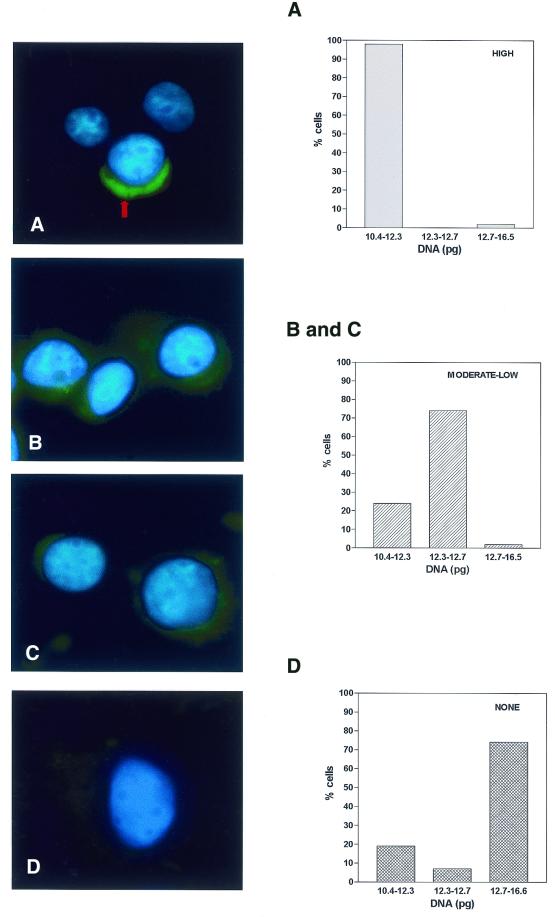
Figure 6.
Detection of hHcsA mRNA by FISH. HeLa cells affixed to microslides were probed with oligonucleotide homologous to hHcsA as described in Materials and Methods. The DNA content of the corresponding cell was determined using quantitative Feulgen staining. Based on this, an assignment was made as to the position of a given cell within the cell cycle. Left, images shown are representative of the three categories of signal intensities observed by immunofluorescence microscopy. (A) High level of cross-reactivity; (B and C) moderate to low level of signal intensity; (D) no signal intensities observed. Right, DNA content of the total population of cells for which images were obtained. Based on the quantitative Feulgen staining (29), cells were assigned to phases of the cell cycle as follows: G1, 10.4–12.3; S, 12.3–12.7; G2/M, 12.7–16.6.

