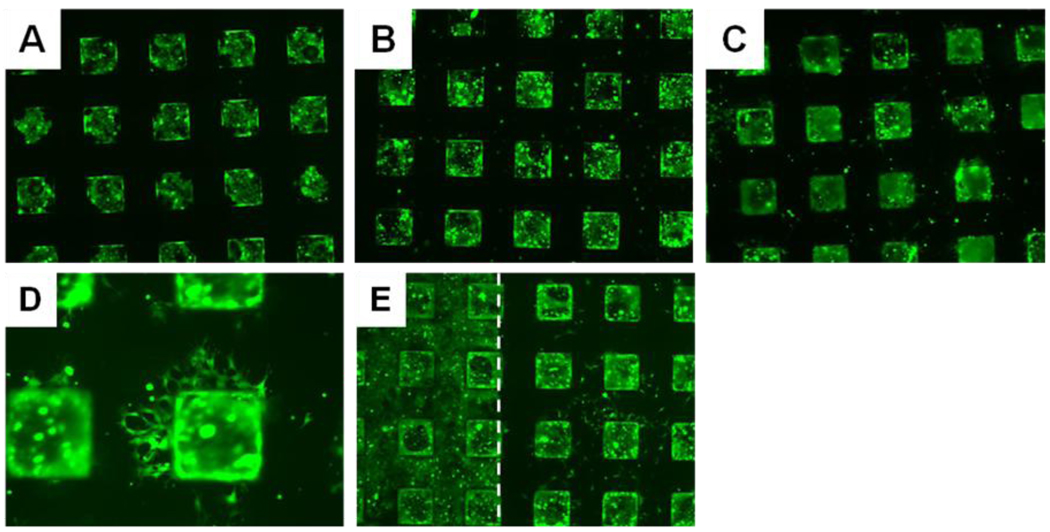
Figure 4.
Representative fluorescence micrographs (4X) of film-coated arrays seeded with COS-7 cells; films were functionalized to introduce glucamine in areas between the wells prior to seeding. Images show calcein-stained cells (A) one day, (B) 14 days, and (C) 28 days after initial seeding. The image in D shows a higher magnification (10X) image of wells from a glucamine-functionalized area acquired after culture for 21 days. The image in E shows the boundary between glucamine-reacted and non-functionalized regions of the same array, also acquired after 21 days. The dashed white line indicates the edge of the functionalized area and is included as a guide to the eye. Microwell dimensions are 300 µm on each side.

