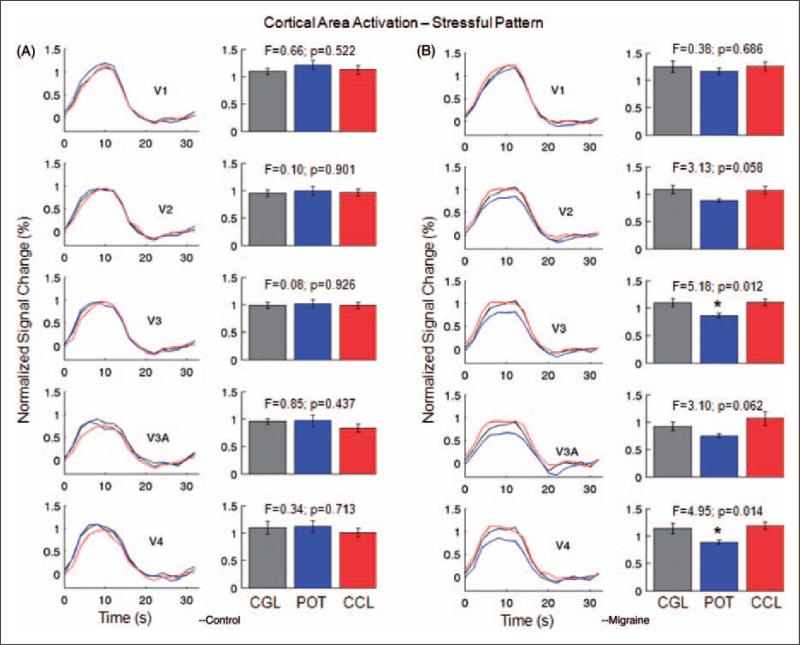
Figure 4.
Normalized activation in visual areas V1, V2, V3, V3A, and V4 from the stressful striped pattern (SF 2.5 cpd) for the control subjects (A) and the migraine patients (B). Left columns in (A) and (B), normalized cortical area activation curves; right columns in (A) and (B), comparison of the peak heights of the normalized cortical area activation curves in the left columns. (Note that, to reduce the filter-induced activation variations, the cortical area response curve to the stressful pattern was normalized by dividing the height of the corresponding cortical area response curve to the non-stressful pattern for each lens.) For the control subjects, cortical area activation showed no difference in any visual area among the three lenses. For the migraine patients, however, the POTs produced significant reductions to cortical activation in V3 and V4. The POTs also reduced the cortical activation in V2 and V3A, though the differences were not statistically significant. Error bars indicate the standard errors of the means. CCL, control coloured lens; CGL, control gray lens; POT, precision ophthalmic tint.

