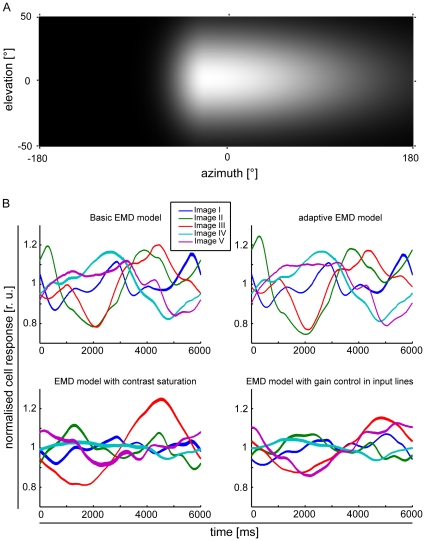
Figure 7. EMD array responses with an estimated HSE cell receptive field.
(A) Weight field estimate of the spatial sensitivity distribution of a model HSE cell. The brighter the gray level the larger the local weight of the corresponding EMDs and, thus, the spatial sensitivity. The frontal equatorial viewing direction is at 0° azimuth and 0° elevation. (B) Normalized response traces of HSE models with the four types of EMD variants as indicated in the figure. Image motion was performed for 12s in preferred direction with an angular velocity of 60°/s. Responses to all image datasets are shown.

