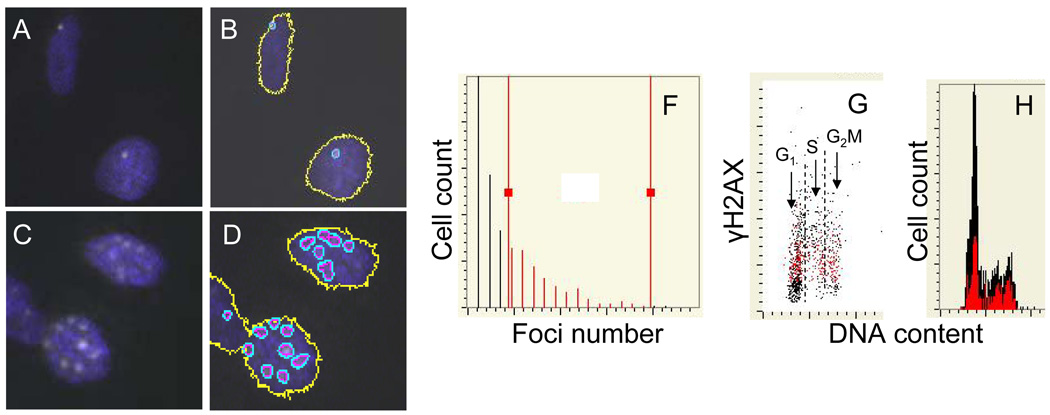
Fig. 10. Analysis of γH2AX foci by laser scanning cytometry (LSC).
A549 cells were either “mock-treated” (A, B) or exposed to smoke from 2R4F tobacco containing cigarettes for 8 min (C,D) and then incubated in culture for 1 h, as described in the legend to Fig. 8. After fixation the presence of γH2AX was detected immunocytochemically (Albino et al., 2009, Jorgensen et al., 2010). The expression of γH2AX was confined to the characteristic IF foci which were more abundant in the smoke-exposed cells. The LSC software, initially developed to quantify fluorescence in situ hybridization (FISH) foci (Kamentsky et al., 1997) have been used to contour and count images of the γH2AX foci (B,D).The multiparameter analysis of LSC was used to plot the distribution of cells from the smoke-exposed cultures with respect to number of foci per cells (E) and the relationship between expression of γH2AX per nucleus and DNA content (F). The gating analysis was performed to select cells with greater than three foci (F, “red gate”) and through “paint-a-gate” analysis to visualize these cells as colored red on the γH2AX versus DNA content bivariate distribution (F), and their cell cycle position on the DNA content histogram (G).

