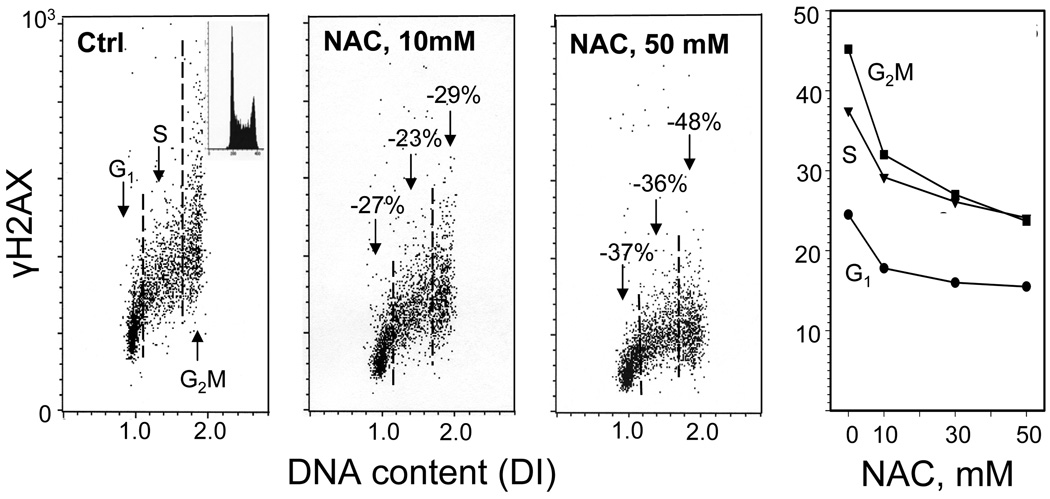
Fig. 9. Attenuation of constitutive expression of γH2AX in TK6 cells exposed to N-acetyl-L-cysteine (NAC).
The bivariate (DNA content versus γH2AX IF) distributions show a decrease in the level of constitutive expression of γH2AX in cells growing in the presence of 10 or 50 mM NAC, added into cultures for 1 h prior to cell harvesting compared to the untreated cells (Ctrl). The percent declines in mean values of γH2AX IF of G1, S and G2M phase cell subpopulations in cultures treated with NAC in relation to the respective subpopulations of the untreated (Ctrl) cells, are marked. The inset in the left panel shows the DNA content frequency histogram representative of the cells in these cultures. The right panel shows the plot of the mean values of γH2AX IF for G1, S and G2M cells, estimated by gating analysis, in relation to NAC concentration (Tanaka et al., 2006).

