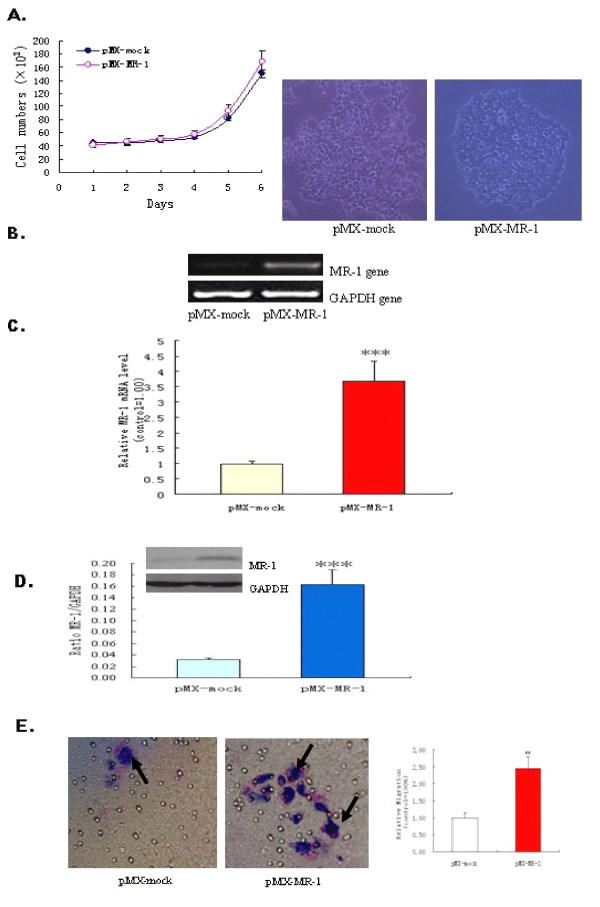
Figure 4.
MR-1 expression in 293T-pMXs-MR-1 and 293T-pMX cells. (A) Cell proliferation was assessed by cell counting, and cell growth was observed under an optical microscope. (B, C) 293T-pMX-MR-1 cells showed increased MR-1 levels as detected by RT-PCR and real-time quantitative PCR. (D) Western blotting showed increased levels of MR-1 protein expression in 293T-pMX-MR-1 cells. (E) Representative images of migrated cells (left: × 400, arrow). Invasiveness of 293T was enhanced by transfection of the MR-1 gene (right). All experiments were repeated at least three times. **P < 0.05; ***P < 0.01 compared with pMX-mock control.

