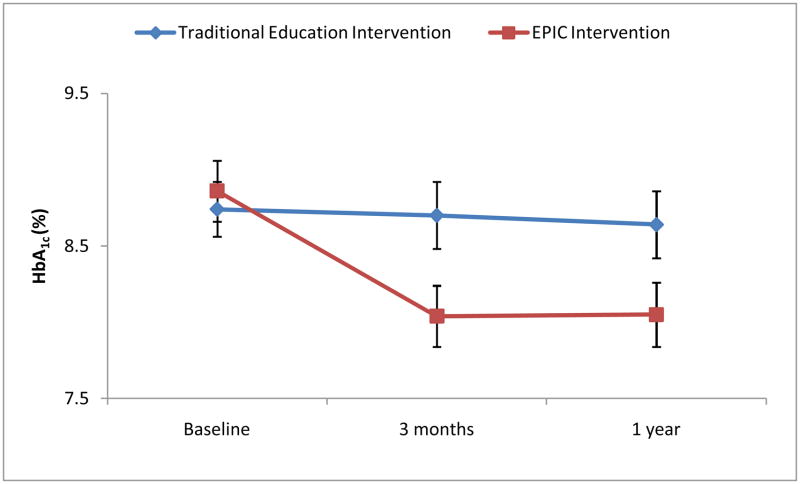
Figure 3. Longitudinal change in Hemoglobin A1c by intervention group.
Each data point represents the mean and standard error values for all patients (n=85) at each data collection time point. Using a repeated measures analysis, the overall effect of the interaction of intervention group by time was significant (F(2,85)= 3.55, P= .03) on longitudinal Hemoglobin A1c values.

