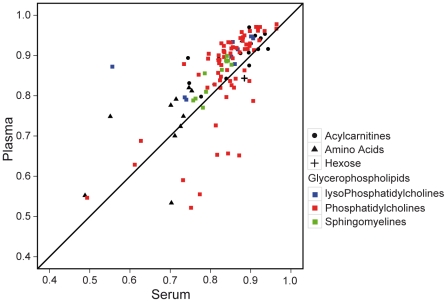
Figure 1. Correlation between repeated measurements of plasma and serum metabolites.
Correlation coefficients (r) between repeated measurements of metabolite concentrations were plotted. r values in serum are plotted against r values in plasma. Shapes represent different groups of metabolites: Acylcarnitines (•), Amino acids (▴), Hexose (+), and Glycerophospholipid (▪). Colors represent different subgroups of glycerophospholipids: lysoPhosphatidylcholine (blue), Phosphatidylcholine (red), and Sphingomyeline (green).

