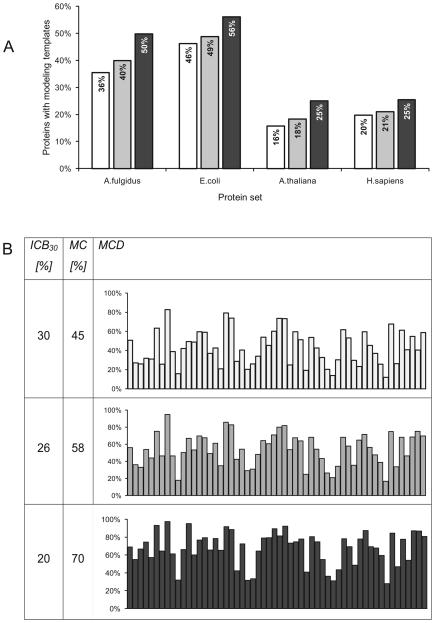
Figure 2.
Modeling coverage of representative sets of proteins calculated with three methods: Blast (white), PSI-Blast (grey), and FFAS (black). Sequence identity cutoffs used to determine the percent of accurately modeled proteins or protein domains were selected to provide the same average model accuracy of 2.6Å (these thresholds are 30%, 26% and 20% for Blast, PSI-Blast and FFAS, respectively; see Methods section).
A) Modeling coverage of proteomes representing Archaea, Bacteria, Plants, and Animals.
B) Modeling coverage of 56 protein superfamilies targeted by the PSI. Horizontal axis on each chart corresponds to 56 protein superfamilies sorted by size.
Columns:
ICB30: globally normalized sequence identity cutoff for each method giving average CαRMSD of 2.6Å in alignments covering at least 50% residues in the Benchmark of alignment accuracy (see Methods section for benchmark description). MC: percent of proteins from superfamilies targeted by the PSI where more than 50% residues are included in the alignment and sequence identity is above the ICB30 cutoff. MCD: distribution of modeling coverage in large protein superfamilies targeted by the PSI.

