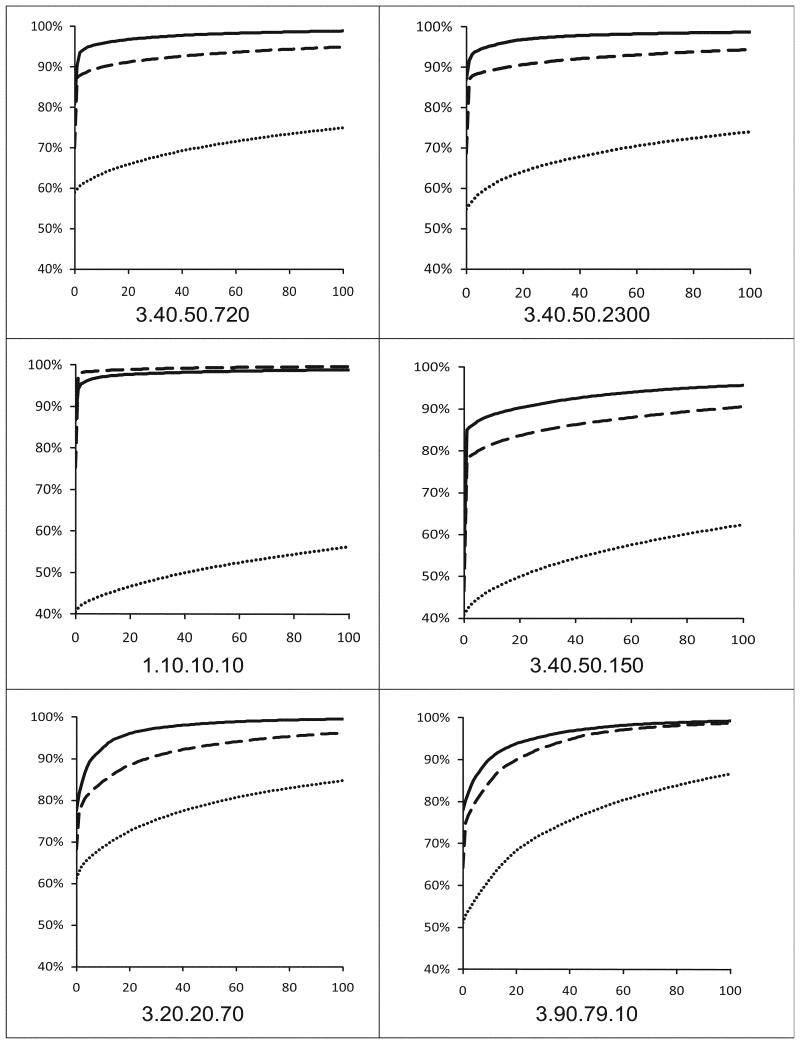
Figure 3.
The “modeling coverage graphs” calculated for the six largest protein superfamilies systematically targeted by the PSI. Each curve shows the percentage of sequences from a superfamily with available models (Y-axis) as a function of the number of proteins whose structures would have to be determined experimentally (X-axis). The graphs were extended only to 100 potential targets for structure determination. Dotted curves represent modeling coverage based on Blast results with 30% sequence identity cutoff, dashed curves represent modeling coverage with PSI-Blast with 26% normalized identity cutoff, and solid curves represent modeling coverage based on FFAS results with 20% normalized identity cutoff (all three thresholds correspond to average models’ accuracy of 2.6Å as calculated using the Benchmark of modeling accuracy).

