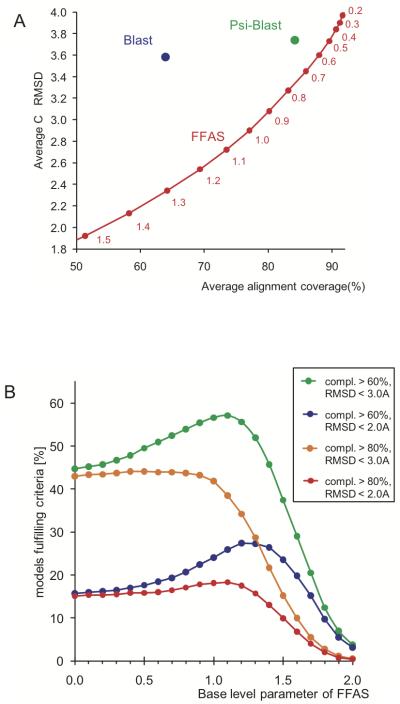
Figure 4.
A) Balance between model completeness and accuracy for different alignment methods. Average completeness and accuracy of Blast and PSI-Blast algorithms with standard parameters are represented as blue and green circles, respectively, while FFAS results are shown as a curve representing a wide range of ‘base level’ values used in the dynamic programming algorithm (‘base level’ values are shown as labels below the curve describing FFAS results). The results were obtained using a comprehensive Benchmark for alignment accuracy (see Methods section for more details). B) The percentage of models from the alignment accuracy benchmark fulfilling different criteria of completeness and accuracy depending as a function of the ‘base level’ parameter of FFAS (see Methods). Green curve shows the percentage of models with completeness higher than 60% and CαRMSD to the real structure below 3.0Å, blue - models with completeness > 60% and CαRMSD < 2.0Å, orange - models with completeness > 80% and CαRMSD < 3.0Å, and red - models with completeness > 80% and CαRMSD < 2.0Å.

