Figure 4.
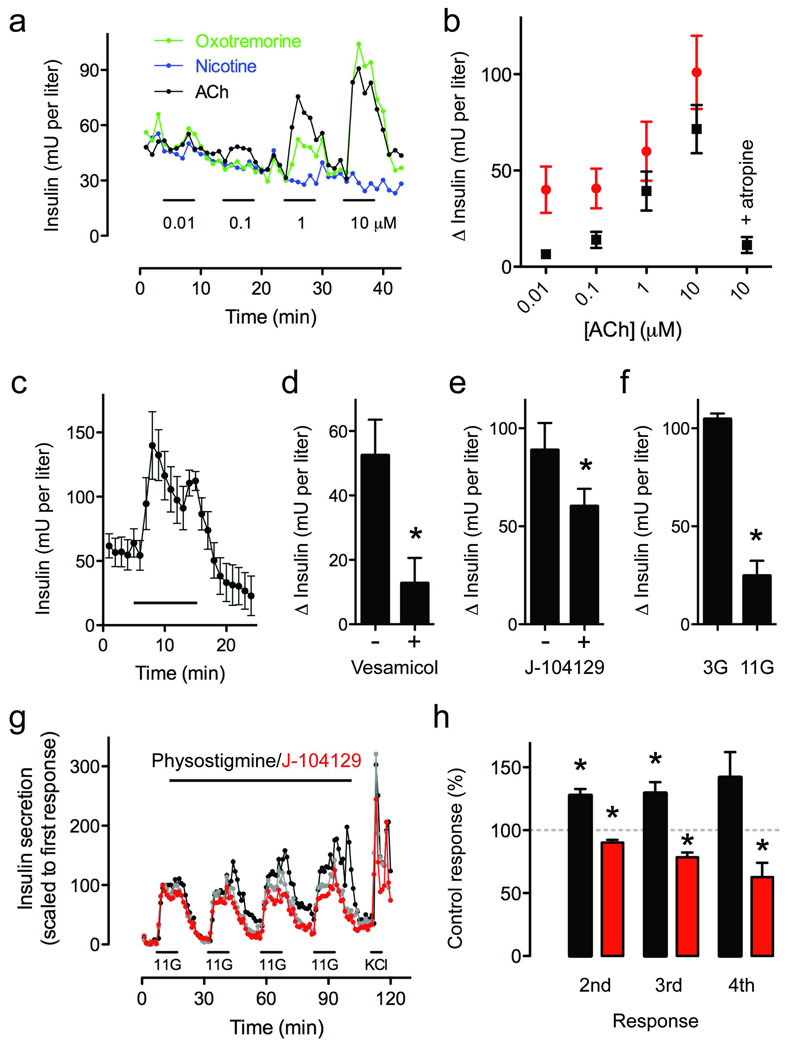
Endogenously released ACh amplifies glucose-induced insulin secretion in human islets. (a) ACh (black trace) and the muscarinic agonist oxotremorine (green trace), but not nicotine (blue trace), elicited concentration-dependent insulin release from human islets. Bars denote stimulus application. Representative traces of n = 3 islet preparations. (b) Summary of data from experiments similar to those shown in a, but conducted in the presence of low (3 mM; black symbols) and high (11 mM; red symbols) glucose (n = 3 preparations). (c) The acetylcholinesterase inhibitor physostigmine (30 µM) increased insulin secretion at 3 mM glucose (n = 5 human islet preparations). (d–f) Physostigmine-induced increases in insulin secretion were significantly inhibited by the vAChT blocker vesamicol (10 µM, d), by the M3 receptor antagonist J-104129 (50 nM, e), or when the experiment was performed at a higher glucose concentration (11 mM, f; Student’s t-test, P < 0.05). (g) Insulin secretion induced by repeatedly raising glucose from 3 mM to 11 mM was increased in the presence of physostigmine (30 µM; black symbols) and reduced in the presence of J-104129 (50 nM; red symbols; representative traces of four experiments). A control experiment with untreated islets was run in parallel (grey symbols). Bar denotes drug application. 11G indicates 15 min of elevated glucose (11 mM). Islets were stimulated four times with glucose followed by 25 mM KCl. (h) Summary of data from experiments such as those shown in c. J-104129 significantly reduced glucose-induced insulin secretion (red bars; n = 4 preparations), whereas the cholinesterase inhibitor physostigmine (30 µM) increased insulin secretion (black bars; n = 5 preparations). Responses are expressed as percentage of the respective insulin response of control islets (100%, grey dashed line). One sample t-tests were used to compare the actual mean to a theoretical mean of 100% (control; *P < 0.05).

