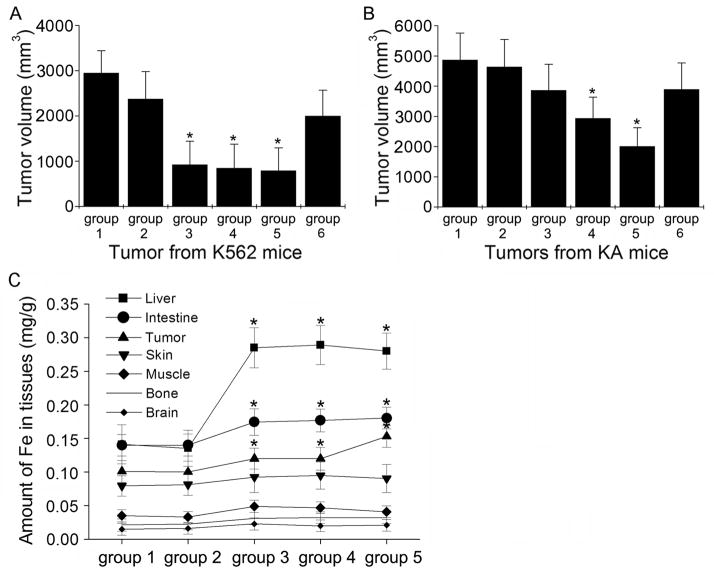
Figure 5.
A. The effect of different treatments on the tumor growth inhibition in nude mice inoculated with K562 cells. Group 1, no treatment; group 2, 0.58 mg/L Fe3O4 nanoparticles; group 3, 1.99×10⁻⁶ mol/L DNR; group 4, 0.58 mg/L Fe3O4 nanoparticles with 1.99×10⁻⁶ mol/L DNR; group 5, the same treatment as group 4 plus a magnet fixed securely close to the tumor site; group 6, 0.58 mg/L Fe3O4 nanoparticles plus a magnet fixed securely close to the tumor site. B. The effect of different treatments on the tumor growth inhibition in nude mice inoculated with KA cells. The 6 groups of mice had the same treatments as shown in (A). Each data point represents the mean ± SD (n = 5). *Indicates significant difference in comparison to the control group 1 (p < 0.05). C. Distribution of Fe levels in liver, intestine, tumor, skin, muscle, bone, and brain from different treatment groups. The K562 and KA nude mice were treated the same way as shown in (A) except group 2 with 1.99×10⁻⁶ mol/L DNR and group 3 with 0.58 mg/L Fe3O4 nanoparticles. *Indicates significant difference in comparison to the control group 1 (p < 0.05).

