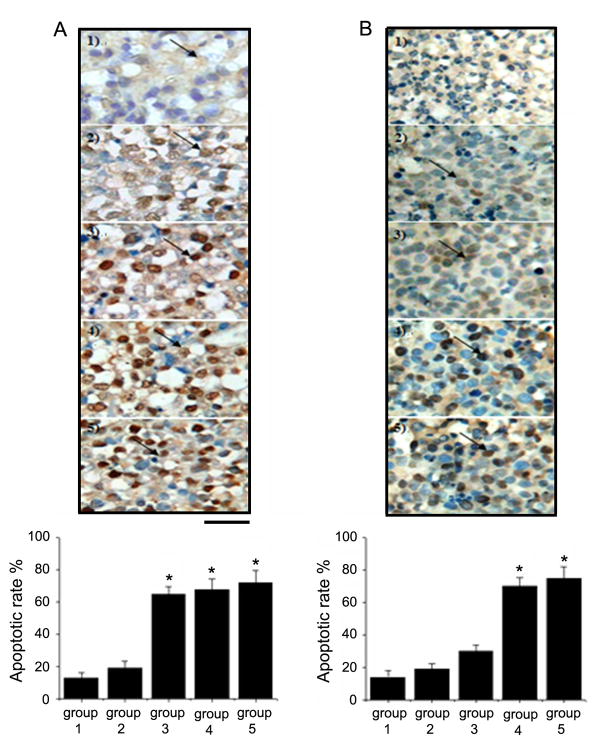
Figure 6.
Immunohistochemical staining of apoptotic cells in K562 and KA xenograft tumors. A. TUNEL staining was performed on tissue sections of K562 xenograft tumors treated as follows: group 1, untreated; group 2, 0.58 mg/L Fe3O4 nanoparticles; group 3, 1.99×10⁻⁶ mol/L DNR; group 4, 0.58 mg/L Fe3O4 nanoparticles with 1.99×10⁻⁶ mol/L DNR; group 5, with the same treatment as group 4 plus a magnet fixed securely close to the tumor site. B. TUNEL staining was performed on tissue sections of KA xenograft tumors. The 5 groups of mice had the same treatments as shown in (A). Arrows: TUNEL positive cells (indicate apoptotic cells). The bar graphs represent the results from three independent experiments. Data are the mean (±SD) number of cells/microscope field from five animals per group. *Indicates significant difference in comparison to the control group (p < 0.05).

