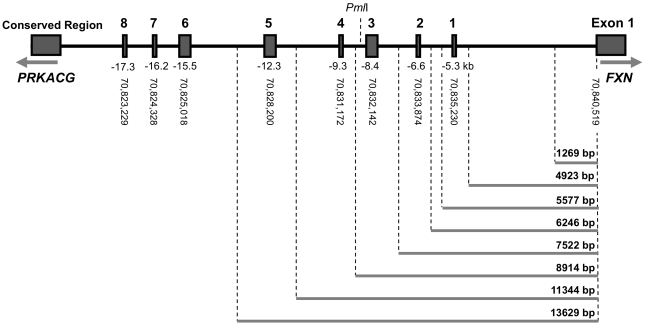
Figure 3. DNA fragments utilized in expression analyses.
Schematic representation of PCR-amplified fragments containing the FXN promoter and conserved regions cloned into the pGL3-Basic vector. The size of each fragment (bp) and the inclusion of particular conserved regions are shown. The location of each of the identified conserved non-coding regions, their distance (kb) from exon 1 of the FXN gene and their coordinates (UCSC Genome Browser, Human March 2006 assembly) are indicated. (Not to scale.)

