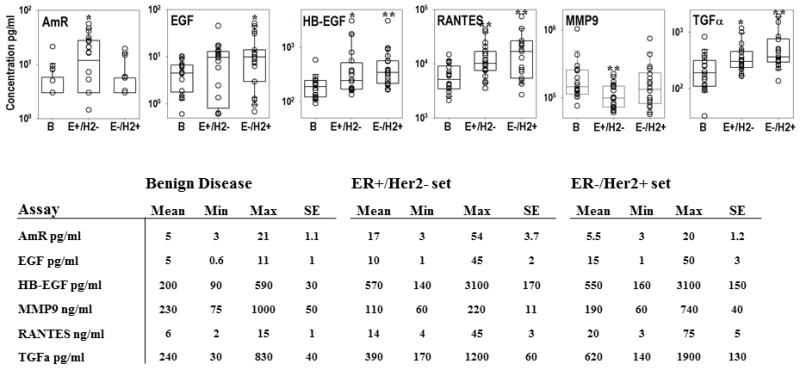
Figure 1.

Protein concentrations in plasma, as determined by ELISA microarray analysis of 18 benign (B), 19 estrogen receptor positive/HER2 receptor negative (ER+/HER2-), and 20 estrogen receptor negative/HER2 receptor positive (ER-/HER2+) patients. Plasma concentrations are graphed for all assays that showed a statistically significant difference between groups, including amphiregulin (AmR), epidermal growth factor (EGF), heparin binding-epidermal growth factor (HB-EGF), matrix metalloproteinase 9 (MMP9), RANTES and transforming growth factor alpha (TGFα). The center line, box and crossbars indicate the group median and 75th and 90th percentiles, respectively. *Significantly different at p<0.05. **Significantly different at p<0.01. Values shown in the table are the mean, minimal (Min) and maximal (Max) concentration values and the standard error (SE) for each assay.
