
Figure 2.
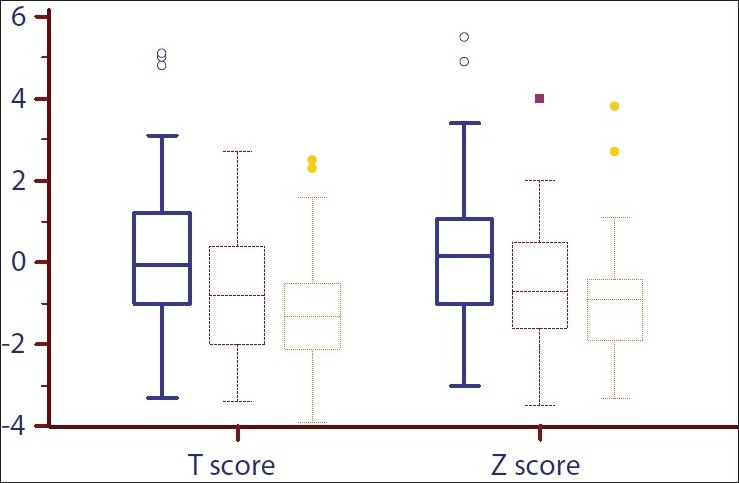
Box-plot showing the distribution of T and Z scores before transplantation and at 3 and 6 months after transplantation. The lower and upper bars represent the 10th and 90th centiles, respectively, and the interquartile range is indicated by the box, the median value being the horizontal line in the box