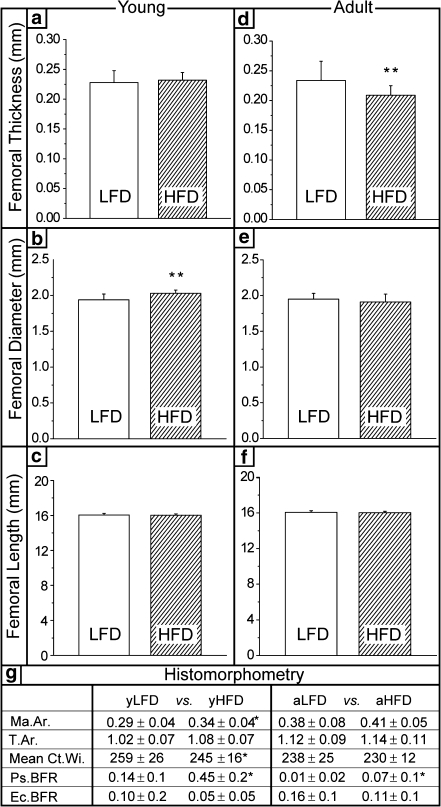
Fig. 3.
Cortical bone size. a Young and d adult cortical thickness is reduced in adults only; b young and e adult femoral diameters are increased in yHFD vs. yLFD; c young and f adult femoral lengths are unchanged. g Histomorphometry results: Ma.Ar. marrow area (mm2), T.Ar. total cros-sectional area (mm2), Mean Ct.Wi. mean cortical width (μm), Ps.BFR and Ec.BFR periosteal and endocortical bone formation rate (μm3/μm2/γ). The general trend in the bone size data points to decreasing bone size in adults and increasing bone size in young obese mice compared to LFD, as well as a shift from periosteal activity to endosteal activity with age. yLFD n = 15, yHFD n = 15, aLFD n = 13, aHFD n = 14 (* p < 0.05, ** p < 0.01, *** p < 0.001)

