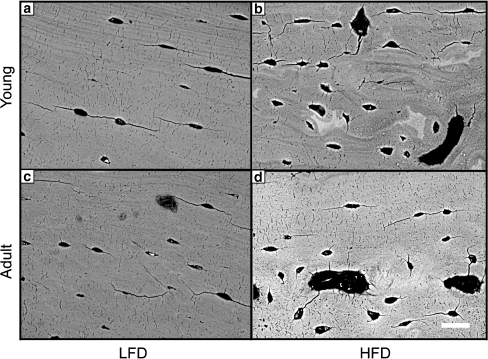
Fig. 5.
SEM images of the fracture region showing cortical bone tissue structure changes at the posterior region. a yLFD group; b yHFD; c aLFD; d aHFD. The scale bar indicates 20 μm. The posterior cortex in HFD bone in (b) and (d) shows reduced alignment of osteocyte lacunae and reduction in lamellar alignment at the tissue level. These images are representative of three samples each of aHFD, yHFD, aLFD, and yLFD. Medial, lateral, and anterior portions of the bone sections appeared similar for HFD and LFD in both age groups

