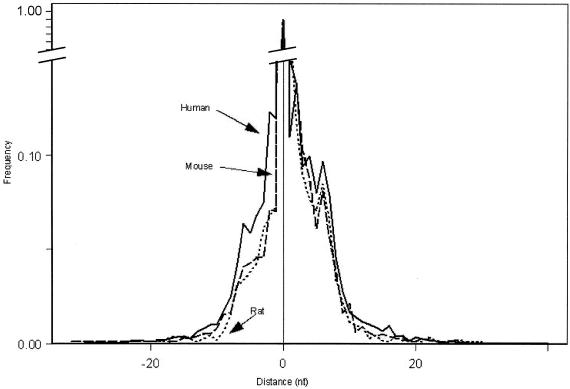
Figure 3.
Distance of alternative cleavage sites relative to wild-type cleavage site in Unigene clusters with alternative polyadenylation. The distance is divided into the number of upstream (–) and downstream (+) nucleotides (x-axis). The most abundant cleavage site is used as a reference and is depicted as 0. Frequency is given on the y-axis. Arrows indicate human, mouse and rat data.

