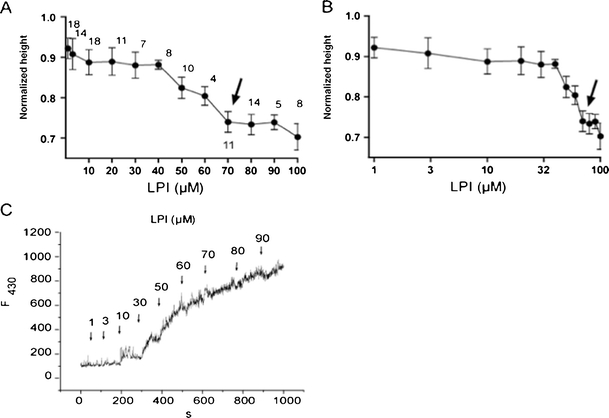
Fig. 4.

Determination of the CMC value for LPI. a and b Determination of CMC level using capillary height method. LPI-evoked changes in capillary height normalized to the mean capillary height level attained in LPI-free 140 mM K+-containing bath solution presented in linear (a) and log scale (b) to expand for clarity the data points derived from high and low LPI concentrations, respectively. Arrows indicate the point where the curve plateaued corresponding to the CMC level. The number of individual measurements is indicated above the averaged data points. c Determination of CMC level for LPI using the fluorescence method. LPI was added cumulatively to a solution containing 0.25 μM dephenylhexatriene in 140 mM K+-based bath solution and the rise in fluorescence at 30 μM LPI corresponds to transition to micelle aggregation. The excitation was 345 nm, fluorescence emission was 430 nm. Representative record out of five experiments
